
In 1835, the French philosopher Auguste Comte made a confident claim about the limits of human knowledge. Stars, he said, are forever beyond our reach. We can measure their distances and movements, but one thing we can never know: “the true nature of the fixed stars, their chemical composition or even their density is for us forever unknown.” Stellar spectroscopy would soon prove him wrong.
Within 30 years, Comte was wrong.
The development of spectroscopy: the analysis of light broken into its component wavelengths – opened the most productive window in the history of astronomy. Without launching a single spacecraft or touching a single atom of starlight, scientists can determine a star’s chemical composition, temperature, surface gravity, rotation speed, magnetic field strength, and whether it’s approaching or receding.
Every photon of starlight is a message. Spectroscopy is how we read it.
Light as Information: The Electromagnetic Spectrum

Visible light is a narrow slice of the electromagnetic spectrum: the full range of electromagnetic radiation from radio waves (long wavelength, low energy) to gamma rays (short wavelength, high energy). What we see with our eyes is the range roughly between 380 nm (violet) and 700 nm (red).
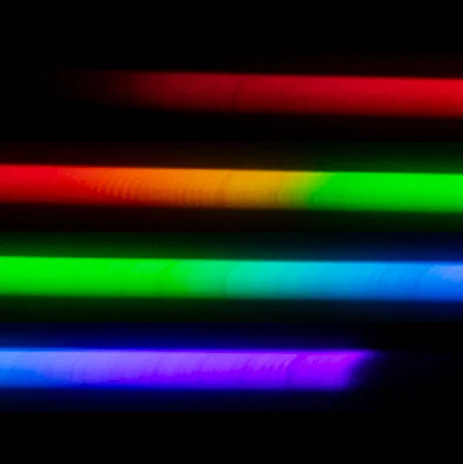
When light passes through a prism or a diffraction grating, it spreads out into its component wavelengths: a spectrum. Sunlight spread this way produces a rainbow: the familiar sequence of red, orange, yellow, green, blue, violet.
In 1666, Isaac Newton showed that white light contains all visible colors. But the deeper secret of spectra wasn’t uncovered until the 19th century.
Stellar Spectroscopy: The Discovery of Spectral Lines
In 1814, German optician Joseph von Fraunhofer used a fine prism to examine the solar spectrum with unprecedented resolution. What he found was remarkable: the sun’s spectrum was crossed by hundreds of dark absorption lines, specific wavelengths where light was missing.
These Fraunhofer lines seemed mysterious. They appeared at precise, reproducible wavelengths. Other stars had different sets of lines.
The explanation came from laboratory experiments. When elements are heated, they emit light at specific, characteristic wavelengths, an emission spectrum unique to each element, like a fingerprint. Conversely, when white light passes through a cool gas, the gas absorbs exactly the same wavelengths it would emit, creating dark absorption lines in the spectrum.
The dark lines in the Sun’s spectrum are caused by cooler gas in the solar atmosphere absorbing specific wavelengths from the light generated deeper in the Sun. Each set of lines corresponds to a specific element absorbing at its characteristic wavelengths.
By matching the solar Fraunhofer lines to laboratory emission spectra, 19th-century scientists could read the Sun’s chemistry. Kirchhoff and Bunsen identified calcium, magnesium, iron, sodium, chromium, nickel, and other elements in the Sun in the 1860s.
The Sun was made of the same stuff as Earth. The universe was chemically unified.
A New Element from the Sun
In 1868, during a total solar eclipse, astronomers observed a bright yellow emission line in the Sun’s spectrum that did not match any known element on Earth. French astronomer Pierre Janssen and English astronomer Norman Lockyer independently detected it. Lockyer named the new element helium: from the Greek helios (the Sun). It was not discovered on Earth until 1895. This discovery dramatically illustrated the power of spectroscopy to reveal not just known elements, but entirely new ones, reinforcing the “cosmic chemical fingerprint” theme that continues today in searches for biosignatures vs technosignatures in exoplanet atmospheres.
The Hydrogen Spectrum and Quantum Mechanics
The most prominent lines in stellar spectra are those of hydrogen, the universe’s most abundant element. The pattern of hydrogen’s spectral lines follows a precise mathematical relationship: the Balmer series (visible hydrogen lines) described by Johann Balmer in 1885.
This pattern, and all atomic spectra, was eventually explained by quantum mechanics. In the quantum model, electrons in atoms occupy discrete energy levels. A photon is absorbed when it has exactly the right energy to kick an electron from a lower to a higher level. A photon is emitted when an electron drops from a higher to a lower level. The energy of the photon corresponds precisely to the energy difference between levels, which corresponds to a specific wavelength.
Each element has a unique set of energy levels, producing a unique spectral fingerprint. Spectral lines are direct windows into the quantum structure of atoms.
Spectral Classification of Stars
As astronomers catalogued stellar spectra in the late 19th and early 20th centuries, they noticed that stars fall into distinct spectral types, not randomly distributed but in a continuous sequence that turned out to reflect temperature.
The Harvard classification system (developed by Edward Pickering, Annie Jump Cannon, and colleagues at Harvard Observatory, where women “computers” did the bulk of the analytical work) classified stars by their spectra into types O, B, A, F, G, K, M: a sequence from hottest (O, surface temperature ~30,000 K, blue) to coolest (M, ~3,000 K, red).
The mnemonic “Oh Be A Fine Girl/Guy, Kiss Me” has been taught to astronomy students for over a century. Cannon herself, a pioneer in a male-dominated field, popularized this sequence and personally classified over 350,000 stars.
Each spectral type shows characteristic absorption features:
- O stars: Ionized helium lines; weak hydrogen lines
- B stars: Neutral helium lines; moderate hydrogen lines
- A stars: Strongest hydrogen (Balmer) lines; some calcium
- F and G stars: Hydrogen weakens; ionized calcium (the H and K lines) becomes prominent; metal lines appear
- K and M stars: Neutral metals dominate; molecules (titanium oxide, calcium hydride) appear in the coolest stars
The Sun is a G-type star: middle-temperature, showing strong calcium H and K absorption, moderate hydrogen lines, and numerous metal lines. Its spectral type immediately tells an astronomer its approximate temperature (~5,778 K), luminosity class, and can provide clues about its evolutionary stage and possible age.
How a Spectrum Is Actually Obtained
A curious reader might wonder how “a few seconds of collected light” becomes a spectrum. At the heart of the process is a spectrograph, a specialized instrument attached to a telescope. Light enters through a narrow slit, which isolates a single star from the background sky. The light is then collimated (made into parallel rays) by a lens or mirror, and sent to a diffraction grating: a surface with thousands of fine, parallel grooves that spreads the light into its component wavelengths. The dispersed light falls onto a detector (typically a CCD, like a digital camera sensor), and the raw image is then calibrated by subtracting instrument noise and correcting for the detector’s sensitivity. The result is a plot of intensity versus wavelength: a spectrum ready for analysis.
This process, now routine, was refined over decades as astronomers learned to account for subtle effects like line blending (where nearby spectral lines overlap) and interstellar extinction (dust that scatters and reddens starlight). Models of stellar atmospheres are needed to interpret observed spectra, especially to account for how pressure and temperature affect line widths and strengths. These models introduce some uncertainties, but they are well-constrained by physical laws.
Beyond Composition: What Spectroscopy Reveals
Chemical composition and temperature are just the beginning of what stellar spectra disclose.
The Doppler Effect: Motion Revealed
When a star moves toward or away from us, its light is Doppler shifted. A star moving toward us has its light compressed to shorter wavelengths (blueshift); a star moving away has its light stretched to longer wavelengths (redshift).
Spectral lines are shifted by a precisely measurable amount that depends on the star’s radial velocity (the component of its velocity along the line of sight). By measuring where spectral lines appear compared to their laboratory wavelengths, astronomers can measure stellar velocities to within a few meters per second.
This technique, radial velocity spectroscopy, has discovered hundreds of exoplanets. A planet orbiting a star tugs the star with its gravity, causing the star to wobble slightly. This wobble produces a periodic Doppler shift in the star’s spectrum, which can be measured to infer the planet’s mass and orbital period. How scientists detect exoplanets often relies on this method, and the same principles are used to study exoplanet atmospheres.
Stellar Rotation
A rotating star has one edge moving toward us and the other moving away. This broadens spectral lines: one side of the star blueshifts its contribution, the other redshifts it. The width of spectral lines (after accounting for other broadening effects) gives the star’s projected rotation speed.
Rapidly rotating stars have very broad, shallow spectral lines. Slowly rotating stars like the Sun have sharp, narrow lines.
Magnetic Fields: Zeeman Splitting
Strong magnetic fields split spectral lines into multiple components: the Zeeman effect. The splitting is proportional to the magnetic field strength. By measuring Zeeman splitting in stellar spectra, astronomers can measure the magnetic fields of distant stars and sunspots.

Starspots on active stars, analogous to sunspots, can be mapped from time-variable Zeeman signals as the star rotates.
Surface Gravity: Luminosity Class
The width of spectral lines also depends on pressure in the stellar atmosphere, which is related to surface gravity. High surface gravity (dense atmospheres, as in white dwarfs) produces broad, pressure-broadened lines. Low surface gravity (extended, tenuous atmospheres, as in giants and supergiants) produces narrow lines.
This luminosity class distinction, combined with temperature, enables astronomers to distinguish dwarf stars like the Sun from giant stars of the same temperature, even from spectra alone.
Chemical Abundances and Stellar Populations
Detailed analysis of spectral line strengths allows measurement of the chemical abundances in a star’s atmosphere: the relative proportions of hydrogen, helium, and all heavier elements (called “metals” in astronomy, even if they’re carbon or oxygen).
Stellar populations reflect galactic history. Stars formed early in the galaxy (Population II stars) have very low metal abundances: they formed from nearly primordial hydrogen and helium. Stars formed more recently (Population I stars) like the Sun have higher metal abundances, enriched by billions of years of stellar nucleosynthesis and supernova explosions.
By measuring the metal abundance of a star, astronomers can read something of its history and where in the galaxy it formed.
5 Things Spectroscopy Tells Us
- Composition: which elements are present and in what proportions
- Temperature: from the spectral type and line ratios
- Motion: radial velocity via the Doppler shift
- Magnetism: magnetic field strength from Zeeman splitting
- Surface Gravity: dwarf vs. giant distinction from line widths
The Cosmic Chemical Fingerprint
Spectroscopy doesn’t only reveal stellar chemistry. It has mapped the chemistry of the entire universe.
Nebulae: The emission spectra of hot gas nebulae, ionized by nearby stars, reveal their composition. The green lines of oxygen, red lines of hydrogen, and blue lines of helium dominate.
Galaxy redshifts: The spectral lines of distant galaxies are shifted to longer wavelengths by cosmic expansion: the cosmological redshift. Measuring this shift gives the galaxy’s recession velocity and, combined with the Hubble constant, its distance. The expansion of the universe was discovered through galaxy spectra. Every photon of starlight carries this message of cosmic expansion.
Exoplanet atmospheres: When an exoplanet passes in front of its star, a fraction of the starlight filters through the planet’s atmosphere. The atmosphere imprints its own absorption features on the transmitted spectrum. JWST is detecting water, carbon dioxide, methane, and sulfur dioxide in exoplanet atmospheres using this technique.
The primordial composition of the universe: The relative abundances of hydrogen, helium, deuterium, and lithium in the oldest stars and in the intergalactic medium measure the conditions of the Big Bang nucleosynthesis, testing cosmological models directly.
A Century of Reading Starlight
The capacity to read a star’s chemical composition, temperature, velocity, rotation, magnetic field, and mass from a few seconds of collected light, from a star thousands of light-years away, forever beyond physical reach, is one of the greatest achievements of human science.
It vindicated Auguste Comte’s contemporaries who refused to accept the limits he placed on knowledge. The universe, it turns out, writes in light. We have learned to read.
Sources
- Hearnshaw, J.B. (1986). The Analysis of Starlight: One Hundred and Fifty Years of Astronomical Spectroscopy. Cambridge University Press.
- Cannon, A.J. & Pickering, E.C. (1901). Spectra of bright stars. Annals of the Harvard College Observatory, 28, 129–265.
- Mayor, M. & Queloz, D. (1995). A Jupiter-mass companion to a solar-type star. Nature, 378, 355–359.
- NASA James Webb Space Telescope. (2022). Webb detects carbon dioxide in exoplanet atmosphere.
- Wikipedia: Annie Jump Cannon, historical context on spectral classification.
- Wikipedia: Helium: discovery of helium in the Sun.
How does spectroscopy reveal the chemical composition of stars?
Each chemical element absorbs or emits light at specific wavelengths, creating unique spectral lines; by analyzing these lines in a star’s spectrum, astronomers can identify which elements are present.
What is a stellar spectrum?
A stellar spectrum is the range of light from a star spread out by wavelength, typically showing a continuous rainbow crossed by dark absorption lines or bright emission lines that encode information about the star’s properties.
Can we really know what stars are made of without going there?
Yes, through spectroscopy, which analyzes the light from stars; the pattern of spectral lines acts like a fingerprint, revealing the star’s chemical composition, temperature, and other characteristics without physical sampling.
Who first used spectroscopy to study stars?
In the 1860s, astronomers like William Huggins and Angelo Secchi pioneered stellar spectroscopy, identifying elements such as hydrogen and helium in stars and proving that stars are made of the same elements found on Earth.
What information can we get from a star’s spectrum besides composition?
A star’s spectrum also reveals its temperature, surface gravity, rotation speed, magnetic field strength, and radial velocity (whether it is moving toward or away from Earth).